
Email marketing statistics every marketer should know
Nothing makes a point better than a good, solid statistic, whether you’re looking for data-backed insights to inform strategy decisions, or just need some numbers to cite in an upcoming meeting.
But some email marketing statistics are more useful than others. How do you find the right ones? We’ve got you covered.
Here’s a round-up of meaningful email marketing statistics every marketer should know. I picked these statistics because they’ve informed my strategies, challenged my assumptions and helped me prioritize.
So without further ado, let’s dive into those numbers.
Most people like getting marketing emails
91% of Americans say they want to get promotional emails from companies they do business with.
In the past, email marketing had something of a bad rap. People associated it with spam, unsolicited marketing emails that plagued inboxes in the early 2000s. Anti-spam laws have since revived email marketing’s reputation, but you may be surprised to learn just how much things have changed.
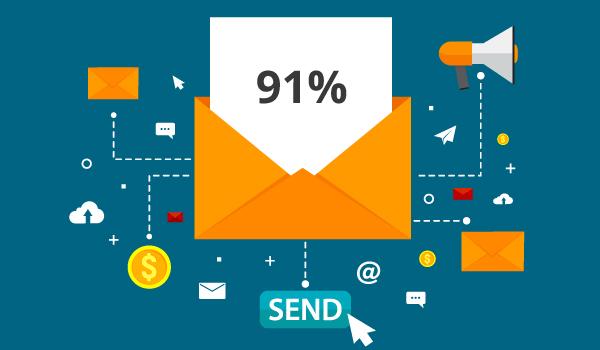
To get some hard numbers, MarketingSherpa conducted a survey. They asked respondents: How often, if ever, would you like to receive promotional emails (e.g., coupons, sales notifications) from companies that you do business with?
91% of people wanted at least some promotional emails. Over 60% of respondents said they wanted to get promotional emails from brands at least weekly.
Exact preferences vary (more on that later), but the vast majority of people these days want emails from companies on a regular basis. And acceptance of all kinds of digital marketing will only keep growing.
Source: MarketingSherpa Survey
Email marketing is the best way to reach millennials online
68% of millennials say they’ve made purchasing decisions based on promotional emails.
There’s been a lot of buzz over innovative marketing techniques to reach millennials. After all, millennials are a key marketing demographic and now make up a majority of the workforce.
With older millennials about to enter their 40s, it’s time to stop thinking of this group as a mysterious cohort of young people you can only reach on social media. Good old fashioned email will do the trick just fine.
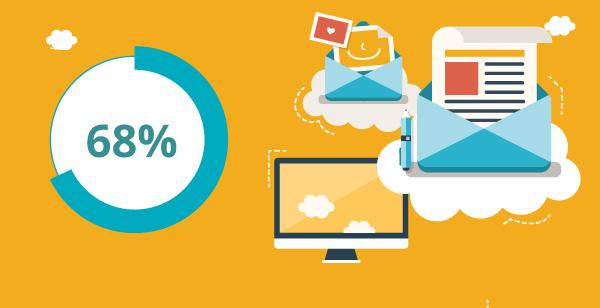
In fact, most millennials say email is their preferred channel for communication from brands, and 68% percent of them say they’ve made purchasing decisions because of promotional emails.
That’s more than any other type of digital marketing, including digital ads and social media.
Source: Fluent Millennial Marketing Report
Segmented campaigns perform better – A lot better
On average, segmented campaigns get 23% more opens and 49% more clicks than unsegmented ones.
If anyone has insight into email marketing data, it’s Mailchimp. When they looked at emails sent through their service, they found segmented campaigns performed much better than unsegmented ones – a whopping 49% better.
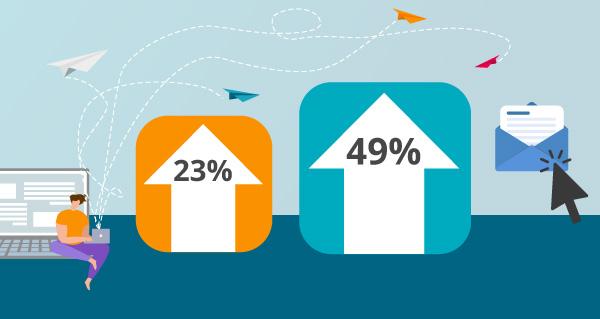
Email segmentation is when marketers divide their mailing list into groups, so they can send different types of emails to different types of contacts. It’s hardly surprising that more targeted emails resulted in more engagement. Still, 49% more clicks is impressive, making this one of my favorite email marketing statistics.
Of course, it’s possible segmented campaigns did better because the teams sending them used more sophisticated marketing techniques in general. Still, whether it’s a causal relationship (segmentation works), or a correlative one (successful email marketers segment their campaigns), it’s a ringing endorsement of segmentation either way.
Source: Mailchimp
People have very different cadence preferences
31% of people like to get emails from brands once a week. 16% only once a month. 15% want emails every day.
The MarketingSherpa survey also reveals why it’s so hard to dial in the right email cadence. People’s preferences vary a lot: from daily, to monthly, to never.
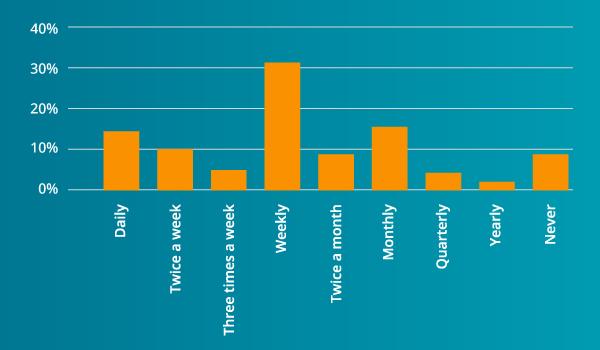
One thing is clear from this data: There’s no pleasing everyone. Even large companies struggle to get it right. In 2015, LinkedIn famously cut back on email notifications after users started to complain.
So what should you do? One option is to test different cadences on your own mailing list to see what works best for your audience. Another is to let your customers set their own preferred cadence, grouping them into segments based on their choices when they sign up to your email newsletter.
Many brands simply accept that they can’t please everyone, and shoot for the average (and most preferred) cadence: weekly marketing emails.
Source: MarketingSherpa Survey
Most people read email on their phones
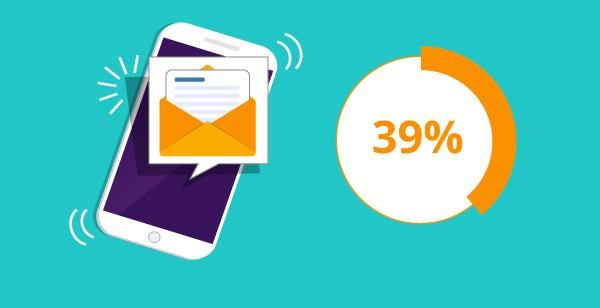
39% of email opens in 2020 were on mobile devices.
In a recent report, Litmus analyzed 10 billion email opens and found 39% of them were on mobile devices.
This meshes with what people say about their behavior. In an Adobe poll of office workers, more people said they regularly check their email on a smartphone than on a computer.
Smartphones mean people are more likely to see your email on the go, or while they’re distracted. 60% of people said they check email while watching TV. Lots of them also check email in bed and (you guessed it) the bathroom.
In short, lots of people are reading emails while doing something else. You’ll need an email marketing strategy that caters to distracted mobile users.
Use responsive design – Make sure your emails look just as good on mobile as they do on desktop and in web clients.
Write short subject lines – Standard advice for email subject lines is under 50 or 60 characters. That’s great for desktop, but phone screens cut subject lines even shorter. Shoot for something under 30 characters to make sure your message gets through.
Write short emails – Subject lines aren’t the only things you need to keep short. People checking email in line at the grocery store aren’t going to read through four paragraphs to figure out what you’re trying to say. Short and sweet is the way to go.
Sources: Litmus 2020 Engagement Report and Adobe 2018 Consumer Email Survey
There’s no such thing as a typical click-through rate
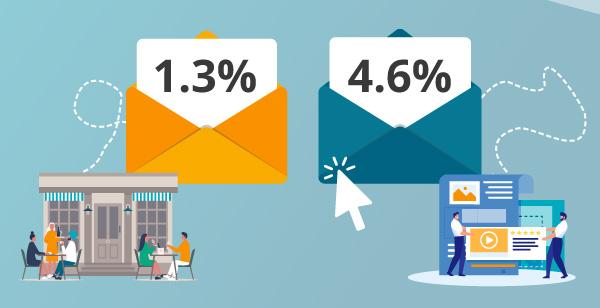
The average click-through rate is 2.6%, but 1.3% is normal in some industries. So is 4.6%.
A lot of marketers want to know what a ‘good’ email click-through rate is. The truth is, there isn’t one. A lot of factors affect click-through rate, most of them beyond your control.
Some types of emails will always perform better than others. Some types of products and services are more conducive to email marketing. Even the industry you’re in will affect what click-through rate you can expect.
Mailchimp dug into the numbers. When they broke their customers’ click rates down by industry, they found some big discrepancies. Publishing and media, for example, tends to have a high click rate of about 4.6%. On the end of the spectrum, 1.3% is normal in the restaurant industry.
So be sure to check out the Mailchimp benchmarks for your own industry to see where you stand. Or, even better, use your own list’s past performance as a benchmark.
Source: Mailchimp
The best email marketing statistics are the ones you collect yourself
The numbers we’ve discussed so far are all fantastic statistics that have shaped how I think about email marketing. But I couldn’t write an article about email marketing statistics without making a slightly different point: The most meaningful statistics are the ones you produce yourself.

That’s because every email marketing audience is different, and best practices and cross-industry takeaways will only get you so far. All kinds of factors specific to your industry, customers and brand identity will affect what works best for your email audience.
Numbers don’t lie, and analytics dashboards make it easy to quantify your campaigns’ performance. So pay attention to those metrics, and use A/B testing to run a few experiments.
To learn how to collect and analyze your own email marketing data, check out our introduction to email campaign optimization.